
Each unit in a Quantway/Statway is represented in RealizeIt by a Learning Map. Each unit's Learning Map contains that unit's learning activities.
A unit's Learning Map contains the learning activities, instantiated as nodes on the map, associated with that unit. The nodes we see on a Learning Map could be Preparations and Exercises (individual assignments), Collaboration sessions (synchronous student group activities), self-reflective learning (SRL) surveys, Productive Persistence activities (e.g. the Growth Mindset Activity), Corequisite Lessons & Practice Problems (individual assignments), and Fundamentals lessons (individual assignments).
Note: In Quantway, a unit's score is made up of 50% from the Preparation and 50% from the Exercise. The unit score is what is synced to the LMS gradebook (if delivering via LTI) or available as a CSV export (if delivering via the MyPathway portal). In Statway, if a unit contains a Preparation, the unit score is split 50/50. However, for most Statway units, only the Exercise contributes (100%) toward the unit score.
Learning Map: Instructor View
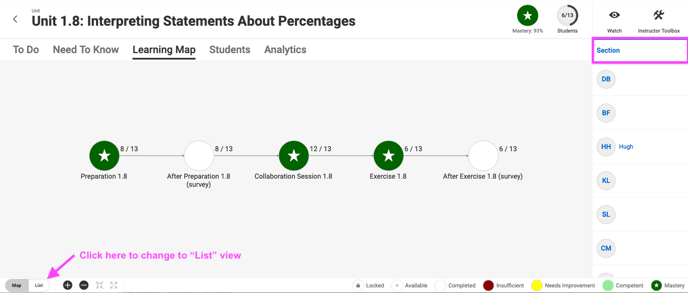
The image below is the instructor view of the Learning Map for Unit 1.8 in Quantway Core. You can see that Section on the right is highlighted, meaning that the statuses of the activities are aggregate for the the entire class. For example, 6 out 13 have completed Exercise 1.8 and 12 out of 13 have completion for Collaboration 1.8. Hovering over a node will display the class aggregate score.
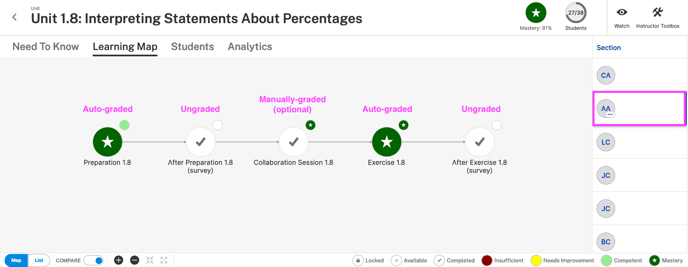
You can dig into a particular student's Learning Map by clicking their name on the right. When you do this, the smaller nodes represent the section aggregate and the larger nodes represent this student's engagement and performance. With the exception of the smaller section aggregate nodes, this is what the student AA would see on their Learning Map for Unit 1.8.
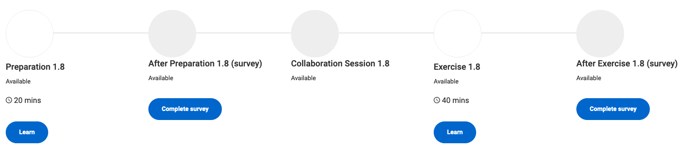
Learning Map: Student View
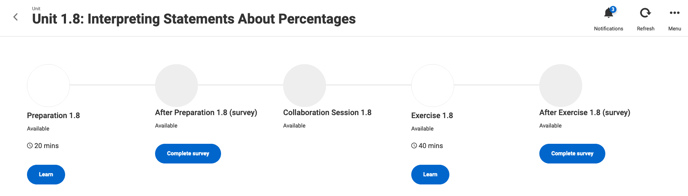
Let's now explore the Learning Map from the student perspective and how the nodes respond to engagement. The image below shows a student's view of the Learning Map for Unit 1.8. The student has not done anything in this unit at this point.
The auto-graded individual assignments/lessons (Preparations, Exercises, Corequisite Lessons & Practice Problems, and Fundamentals lessons) will display student scores once a student has achieved a score in the graded section of the activity that is 1% or higher.
Let's explore a Quantway example. Remember, in Quantway student scores in Preparations and Exercises are aggregates; in Statway, it a student's highest score that is recorded.
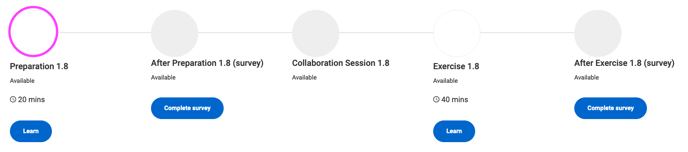
Now, let's imagine the above student goes through Preparation 1.8 (an auto-graded individual assignment) and gets all questions in the Questions section incorrect. Upon completion, the student will see a message like this:
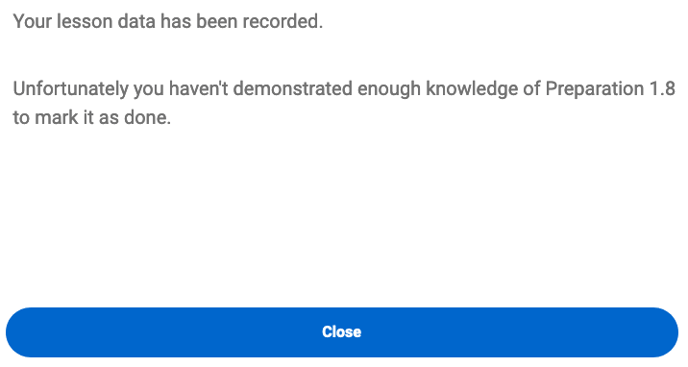
As such, the status of Preparation 1.8 for this student on their Learning Map will not change.
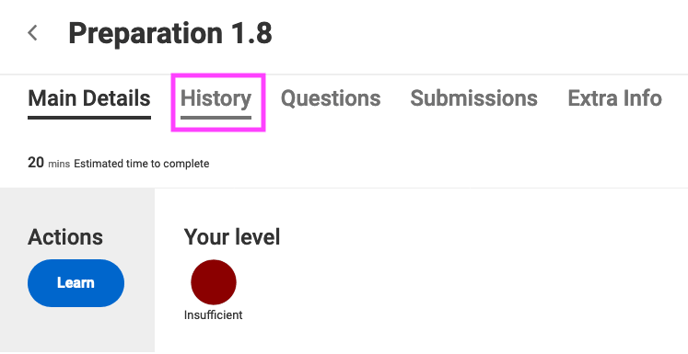
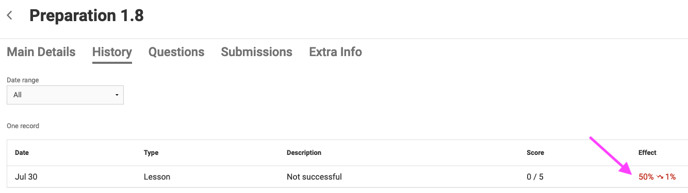
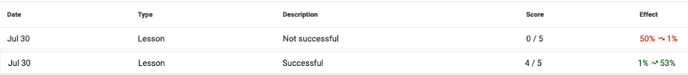
The student can click the Preparation 1.8 node and check the assignment history (instructors can check student assignment history also) to see how this affected their score. In History for this student's engagement with Preparation 1.8, it will show 1 unsuccessful attempt (as it was below 1%), which dropped the student's score from 50% (the default starting point) to 1%.
Now, let's imagine the student goes into Preparation 1.8 again for a second attempt and this time gets 4 out 5 questions in the Questions section correct. Upon completion, they'll see the following message:
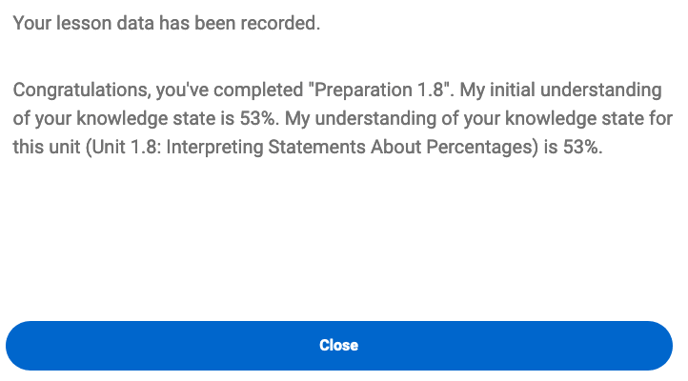
The student now has a knowledge state of 53%, a rough aggregate of 0% and 80% Additionally, given that in the second attempt the student 80% (4 out of 5 correct), which is greater 1%, the student's Learning Map will now reflect their performance:
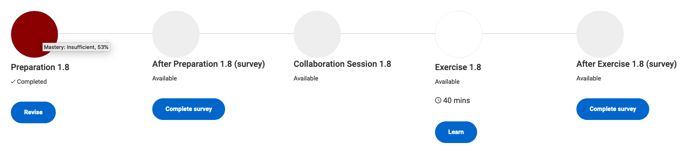
And in History, we can see the second attempt successful and jumped the student's score from 1% to 53%. Why is not 80%, you might ask? As mentioned, the RealizeIt system uses all attempts here to gauge student comprehension, and thus roughly averages the attempts in its score calculation. This is why the student's score is 53%.
In Statway courses, when exploring activity history you will see how each activity engagement impacted comprehension, but the score that will be recorded/displayed (and passed to the LMS gradebook) will be the highest score achieved.
Now, let's explore the mastery bands:
- Insufficient (red) = 0% - 60%
- Needs Improvement (yellow) = 60%-80%
- Competent (light green) = 80%-90%
- Mastery (dark green with star) = 90%-100%
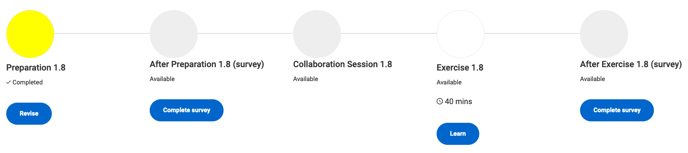
Let's return to our example...imagine that the student goes into Preparation 1.8 for a third time and gets 4 out of 5 again, pushing their score up from 53% to 70% (from the red Insufficient band into the yellow Needs Improvement band); their Learning Map will update accordingly:
It is in this manner that the Learning Map will update in accordance with student engagement and performance. Note that the ungraded and manual graded activities operate in a different manner. Completion of survey activities is marked with a check, and completion of Collaboration session is marked with a check, but only after you have "Marked student as complete" during your Collaboration reviewing/grading.