
Every unit has its own Learning Map. A unit's Learning Map contains the activities associated with that unit.
Learning Map: Student View
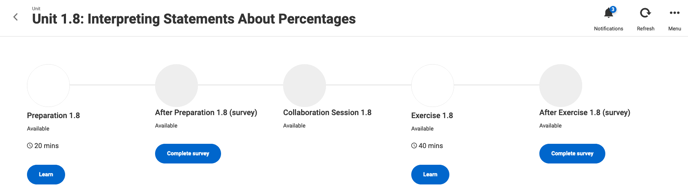
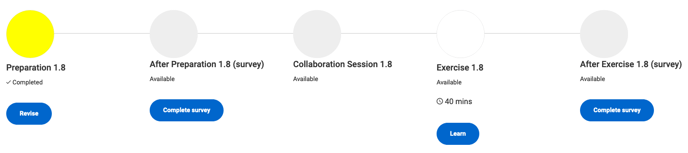
Let's explore the Learning Map from the student perspective and how the nodes respond to engagement. The image below is a student's view of the Learning Map for Unit 1.8. The student has not done anything in this unit at this point.
Individual activities/lessons (Preparations, Exercises, Corequisite Lessons & Practice Problems, and Fundamentals lessons) are auto-graded; collaborations (if done) are given a grade manually by your instructor. Once you complete the graded section of the activity, you'll see your score reflected on the Learning Map.
If you answer all questions in a graded section incorrectly, the Learning Map will not update. It only updates with non-0 scores.
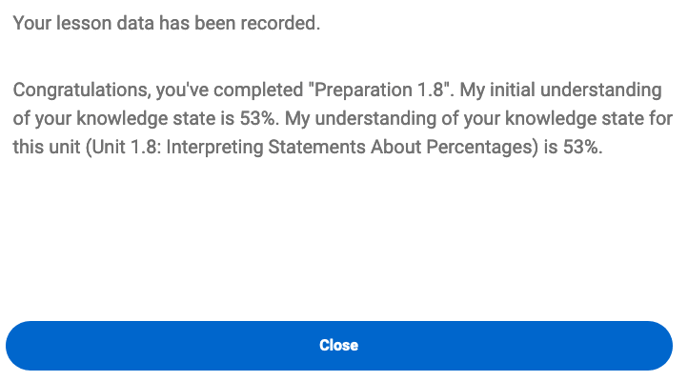
Let's explore a Quantway example. Imagine the above student goes through Preparation 1.8 (an auto-graded individual assignment) and gets all questions in the Questions section incorrect. Upon completion, the student will see a message like this:
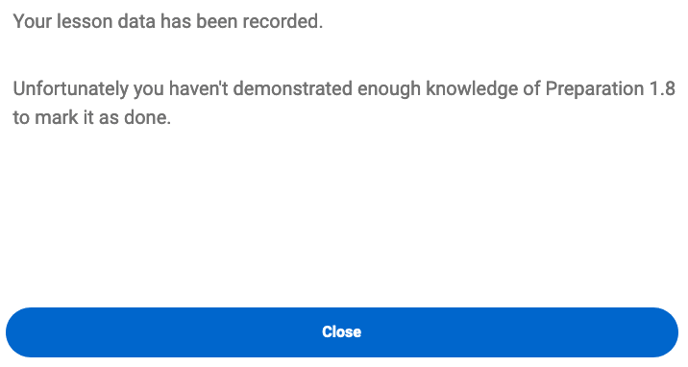
As such, the status of Preparation 1.8 for this student on their Learning Map will not change.
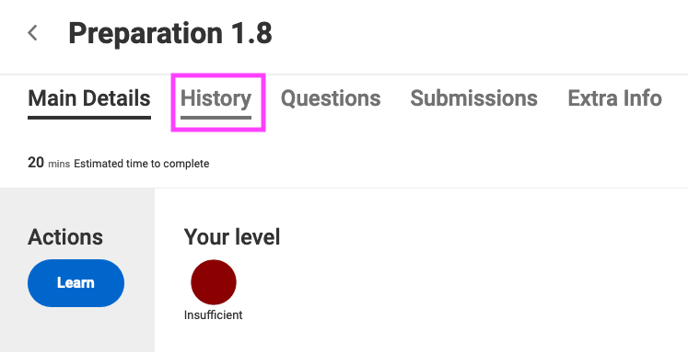
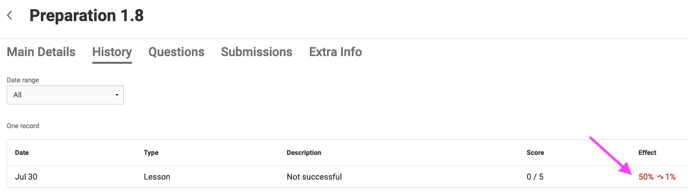
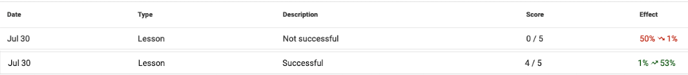
The student can click the Preparation 1.8 node and check the assignment history to see how this affected their score. In History for this student's engagement with Preparation 1.8, it will show 1 unsuccessful attempt (as it was 0%), which dropped the student's score from 50% (the default starting point) to 1%.
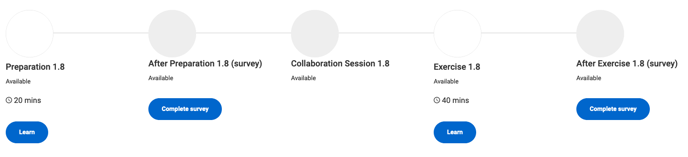
Now, let's imagine the student goes into Preparation 1.8 again for a second attempt and this time gets 4 out 5 questions in the Questions section correct. Upon completion, they'll see the following message:
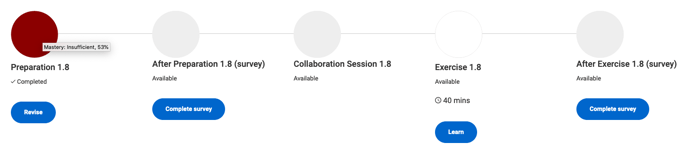
The student now has a knowledge state of 53%. Additionally, given that in the second attempt the student 80% (4 out of 5 correct), which is a non-0 score, the Learning Map will update to reflect their performance:
And in History, we can see the second attempt successful and jumped the student's score from 1% to 53%. Why is not 80%, you might ask? As mentioned, the RealizeIt system uses all attempts here to gauge comprehension, and thus roughly averages the attempts in its score calculation. This is why the student's score is 53%.
IMPORTANT: In Statway courses, it is the highest score that is recorded, not a weighted average. In a Statway Preparation or Exercise, if your highest score is 90%, it is that score that will display on the Learning map.
Now, let's explore the mastery bands:
Beginner (dark red) = 0% - 40%
Improving (red) = 40% - 55%
Competent (Orange) = 55% - 70%
Expert (light green) = 70% - 90%
Mastery (dark green with star) = 90% - 100%
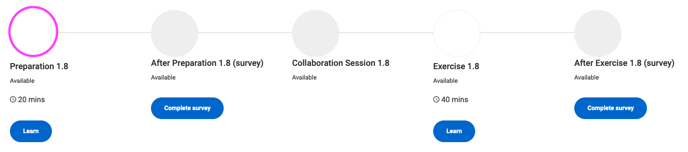
Let's return to our example. Imagine that the student goes into Preparation 1.8 for a third time and gets 4 out of 5 again, pushing their score up from 53% to 70% (from the red Insufficient band into the yellow Needs Improvement band); their Learning Map will update accordingly:
It is in this manner that the Learning Map will update in accordance with student engagement and performance. Note that the ungraded and manual graded activities operate in a different manner. Completion of survey activities is marked with a check, and completion of Collaboration sessions is marked with a check, but only after your instructor "Marked student as complete" during the Collaboration reviewing/grading.